General Chart | Age Chart | Body Fat Alternative
What is your ideal body fat percentage? How lean should you be? Below are two body fat percentage charts, which I will walk you through and provide insights into how to read each chart. The first chart from the American Council On Exercise (ACE) does not include age, but the Jackson-Pollock chart does. If you read until the end, I’ll share a better metric than body fat percentage that’s also much easier to measure! Related Articles
- Body Fat Percentage Photos
- How To Measure Your Body Fat Percentage
- Calculate Your Perfect Weight With Body Fat Percentages
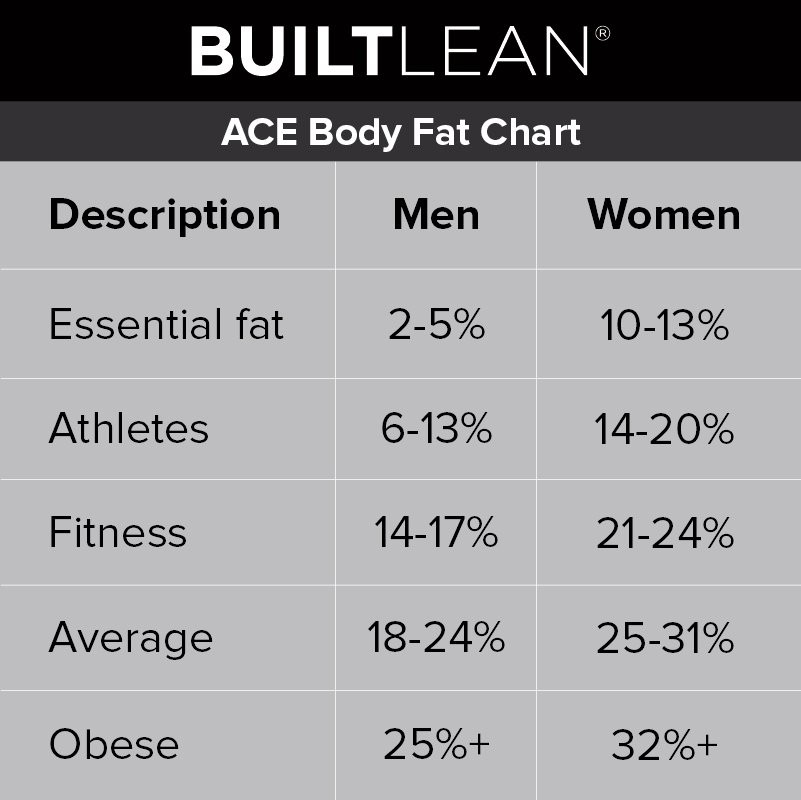
ACE Body Fat Percentage Chart
This chart from ACE is one of the most commonly used body fat charts. Exercise AC. Ace Lifestyle & Weight Management Consultant Manual, The Ultimate Resource for Fitness Professionals . American Council on Exercise; 2009. (affiliate link)1 As you can see, women have a higher body fat percentage than men at a given level. This is because of physiological differences, including hormones, breasts, and sexual organs. In addition, women need a higher amount of body fat for ovulation.
 “Essential fat” is the minimum amount necessary for physical health. There is a lot of controversy over what amount of body fat is optimal for overall health. A research paper in the American Journal of Clinical Nutrition concluded that specific low body fat ranges are “underfat,” which implies unhealthy.Gallagher D, Heymsfield SB, Heo M, Jebb SA, Murgatroyd PR, Sakamoto Y. Healthy percentage body fat ranges: an approach for developing guidelines based on body mass index . Am J Clin Nutr. 2000;72(3):694-701.2 According to this paper, men between 20 and 40 years old with under 8% body fat are considered “underfat,” whereas a “healthy” range is between 8 and 19%. For women in this same age group, any level under 21% is “underfat,” and 21-33% is considered “healthy.” Body fat is an essential measure of health, but stating a specific body fat level is “unhealthy” doesn’t tell the whole story. In fact, some overweight people who exercise can be healthier than their leaner, non-exercising counterparts.Flegal KM, Kit BK, Orpana H, Graubard BI. Association of all-cause mortality with overweight and obesity using standard body mass index categories: a systematic review and meta-analysis . JAMA. 2013;309(1):71-82.3 Conversely, to imply that anyone below 8% body fat with exceptional fitness who eats well is “underfat”, or “unhealthy” is a stretch. We all have different shapes, sizes, and fat distribution profiles, but the chart above is a good starting point. The limitation of the ACE chart is that while it takes into account gender differences, it does not take into account your age, which is precisely why I included the following chart.
Jackson & Pollock Body Fat Percentage Chart
AccuFitness is the maker of a popular body fat caliper (affiliate link), a one-site skinfold body fat measurement method. When you buy the product, AccuFitness includes a body fat percentage chart based on research by Jackson & Pollock (which has become the industry standard) that, aesthetically and from a health perspective, is right on the money. If you don’t understand how to read this chart, find your age in the left-hand column, then see the corresponding body fat percentage to the right. For a 30-year-old man, a body fat percentage of around 12.7% is considered ideal.
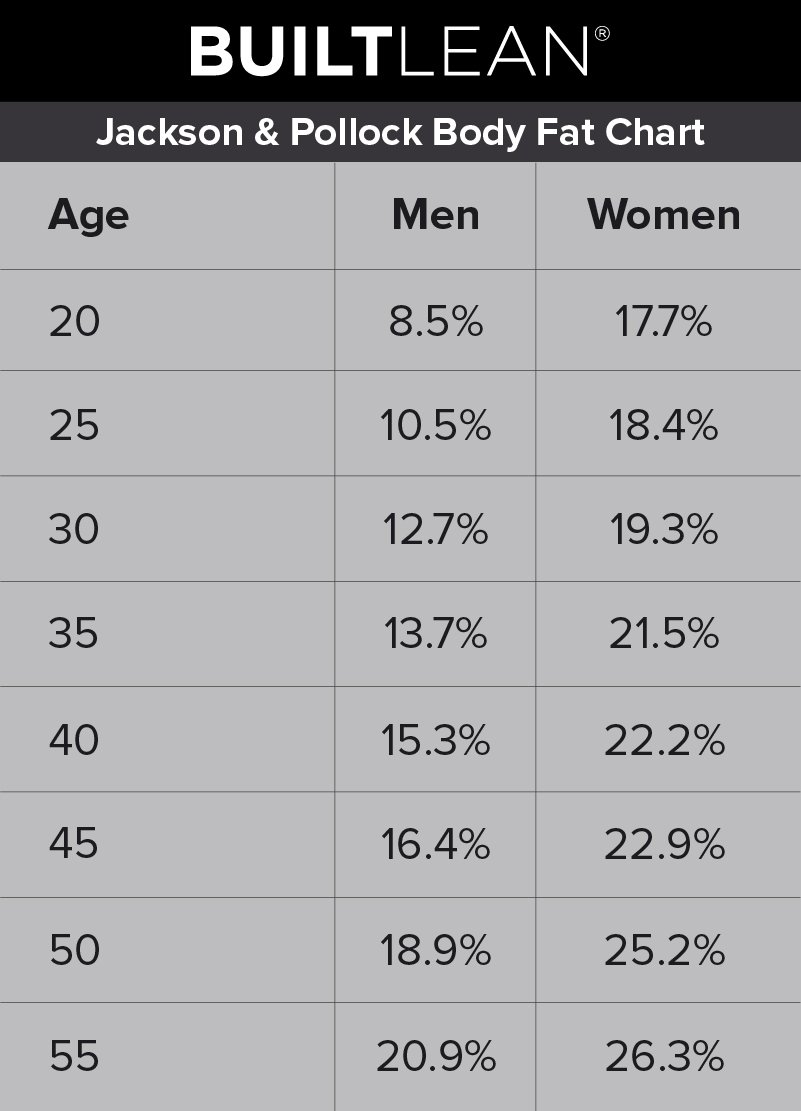 You may have noticed that as your age increases, your acceptable body fat within these ranges also increases. Why, you ask? In short, these charts are based on statistical assumptions. Older individuals tend to have a lower body density for the exact skinfold measurements, which is assumed to indicate a higher body fat percentage. Older, athletic individuals, however, might not fit this assumption because their body density may be underestimated. Digging a little deeper, there are 3 types of fat:
- Subcutaneous (i.e. under the skin)
- Visceral (i.e. around the organs)
- Intramuscular (i.e. in between muscles, like a marbled steak).
Your subcutaneous body fat may stay the same, but the visceral and intramuscular fat may increase as you age.
So what’s a better metric than body fat percentage?
Waist size is a simpler and better health metric than body fat percentage or BMI. Even better is your waist-to-height ratio.Ashwell M, Gunn P, Gibson S. Waist-to-height ratio is a better screening tool than waist circumference and BMI for adult cardiometabolic risk factors: systematic review and meta-analysis . Obes Rev. 2012;13(3):275-286.4 Divide your waist by your height, which works in centimeters or inches. If your waist size is under half your height, that’s considered “healthy.” To measure your waist, measure 1 inch above the belly button. Measure after your exhale. Don’t suck it in! I hope this discussion of ideal body fat percentage was helpful for you!